Cisco Expressway’s diagnostic logging and packet capture capabilities unlock deep visibility into system activity and network traffic during configuration, call setup and user registration workflows. These tools are invaluable for IT professionals debugging real network problems and they are equally critical for candidates preparing for the Cisco 300‑820 CLCEI exam, where scenario‑based questions often require understanding real event traces.
1. What Expressway Diagnostic Logging Does
Diagnostic logging in Cisco Expressway lets you record detailed system events over a period of time, capturing the server’s internal operations during the issue you’re troubleshooting. When enabled, this diagnostic mode extracts a snapshot of relevant activity- including system events and SIP messaging- and makes it available for download. Optionally, you can capture network packets (.pcap files) simultaneously, allowing you to analyze the exact traffic flowing through Expressway.
Unlike standard logs, diagnostic logs go deeper and include debug‑level detail that helps uncover issues such as failed signaling exchanges, NAT traversal complications, or authentication problems that are otherwise invisible in regular logs.
2.When to Use Logging & PCAPs
You should enable logging and packet capture whenever symptoms suggest a deeper issue that basic monitoring doesn’t fully explain. For example, if users cannot register via MRA or Jabber, the diagnostic log combined with packet capture can show whether SRV records resolve correctly, whether the SIP REGISTER reaches Expressway‑Core and gets a proper response, or if DNS failures occur before a response is ever sent. In the case of B2B call setup problems where calls fail silently or abruptly, a .pcap file lets you follow every SIP interaction and spot where the session breaks down.
When audio flows in only one direction, packet captures show whether RTP media is being blocked, dropped, or misrouted due to NAT or firewall behavior. In all of these situations, combining logs and PCAPs gives you both a timeline of events and a network view of the traffic itself- a combination that is often tested in CLCEI exam scenarios and used in real‑world troubleshooting.
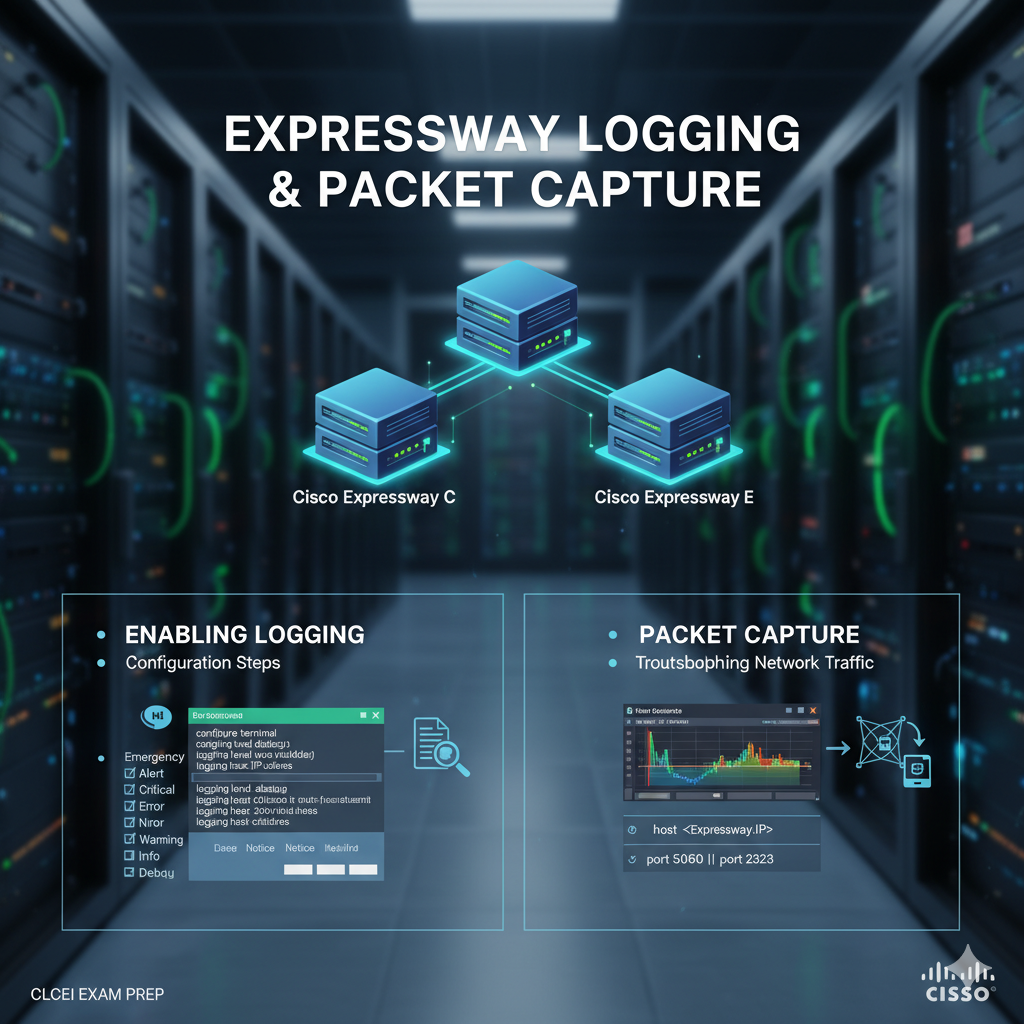
3. How to Enable Expressway Diagnostic Logging
To turn on diagnostic logging and packet capture in Cisco Expressway, start by accessing the Expressway web interface and navigating to Maintenance → Diagnostics → Diagnostic logging. On this page, you will see an option labeled Take tcpdump while logging; checking this enables packet capture alongside your logs. If you want to limit the volume of captured data, Expressway allows you to provide IP address and port filters for the tcpdump.
Before reproducing the issue, consider adding a descriptive Marker– this inserts specific text flagged with DEBUG_MARKER into your logs so you can quickly locate relevant sections later.
After setting up, click Start new log, perform the actions you want to capture (such as attempting an MRA login or making a test call) and then click Stop logging once the testing is done. At this point, you can Download log to save the diagnostic archive to your local machine for analysis. It’s important to note that Expressway only keeps one diagnostic session at a time; starting a new session replaces any previously collected logs.
This process also ties closely into exam preparation because capturing real event timelines and packet data can be matched to your Practice Test for CLCEI Exam scenarios, reinforcing your understanding of how issues manifest in trace outputs.
4. What You’ll Get in the Log Bundle
Once you download the diagnostic archive from Expressway, you’ll find a collection of files that together paint a complete picture of what happened during the diagnostic window. There is typically a loggingsnapshot file containing all of the events the system captured, a configuration snapshot showing the Expressway settings at the moment logging began and a status dump with module and system metrics.
If packet capture was enabled, you’ll also see one or more .pcap files containing raw network packets that express the SIP, DNS and media flows. There may also be server certificates in the bundle, which can be useful when troubleshooting TLS or secure SIP interactions. Having these elements together- timeline information, configuration context and packet‑level details- lets you match events between logs and traffic captures, dramatically simplifying the process of diagnosing problems or verifying the behavior that exam scenarios describe.
5.Basic Log & PCAP Interpretation
To begin interpreting what you’ve captured, first open the text logs in any editor and search for errors, authentication failures, or the marker text you inserted before reproducing the issue. This often gets you directly to the relevant timeframe without endless scrolling. For packet captures, open the .pcap files in a tool such as Wireshark and filter traffic by protocols like SIP for signaling, RTP for media and TCP/TLS for encrypted sessions. By correlating timestamps between your diagnostic logs and the PCAP timeline, you can determine exactly where a call setup fails, where a DNS lookup returns the wrong response, or where a media flow drops out. This methodical analysis reflects real troubleshooting workflows and mirrors the level of detail tested in the Cisco CLCEI exam.
Frequently Asked Questions (FAQs)
- Why should I use diagnostic logging instead of standard logs?
Diagnostic logging provides debug‑level event detail and optional packet captures that reveal low‑level behavior not shown in normal logs. - Is packet capture available while Expressway continues to operate?
Yes, you can enable packet capture (tcpdump) while logging is active and the resulting PCAP files document live traffic during that period. - How do markers help during troubleshooting?
Markers insert identifiable text tags into logs, helping you quickly jump to the timeframe you care about when analyzing large logs later.